

1Report page 1
Critical Power (CP)
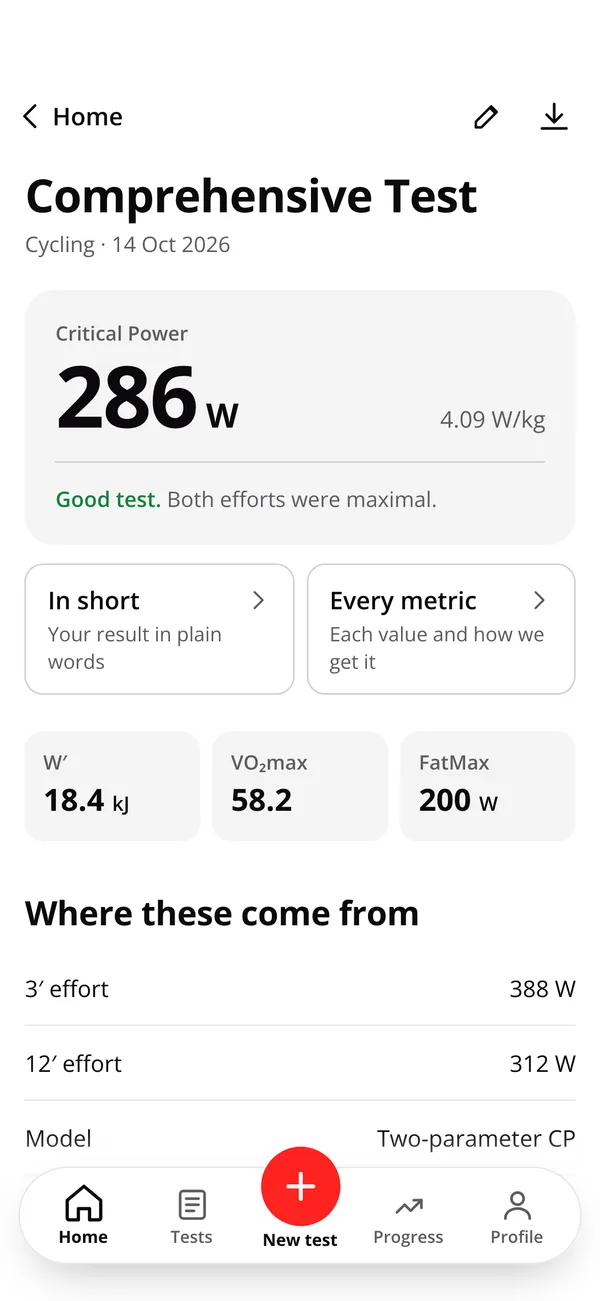
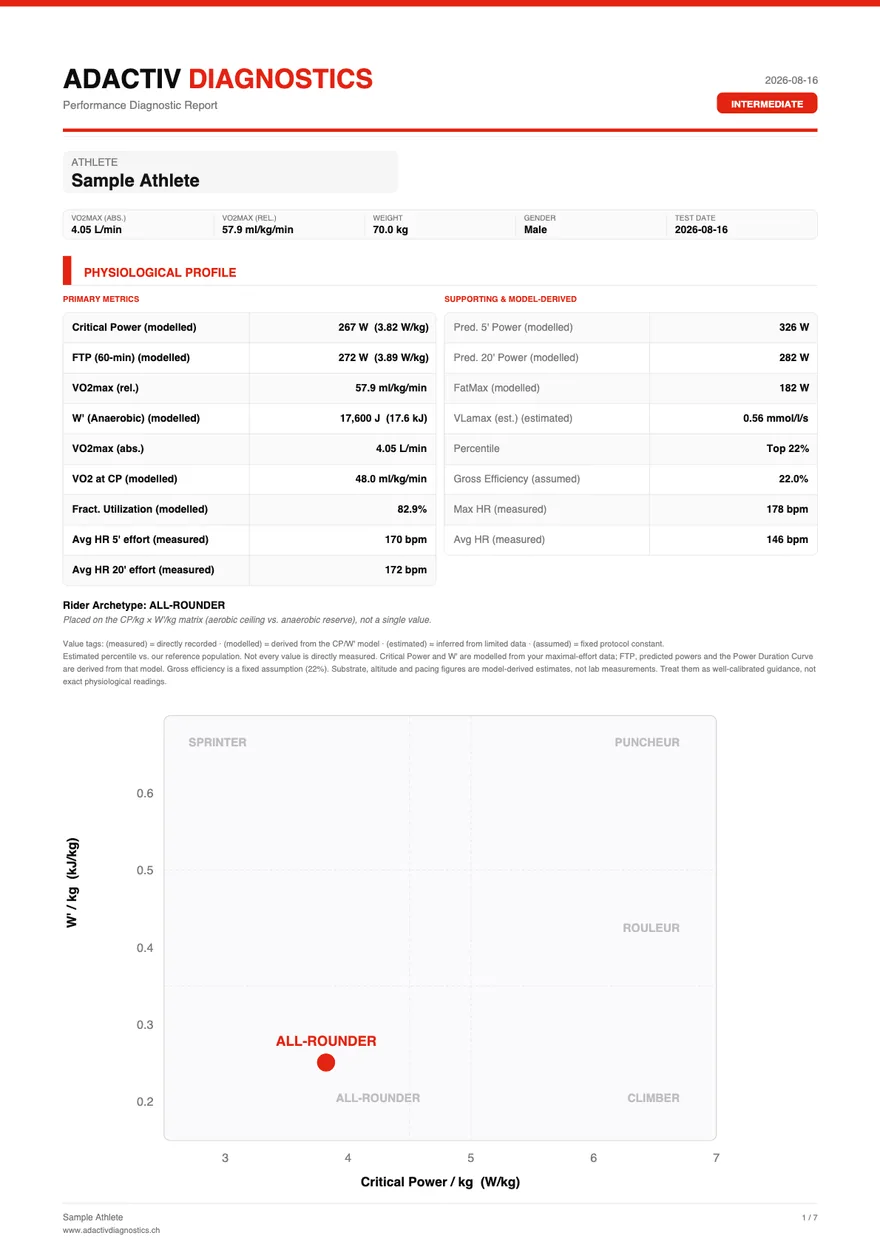
Unlike FTP, a true physiological threshold: the highest power you can sustain aerobically over the long run. It is the foundation for your training zones and for steering your endurance training.


A scientific report from at least one ride.
View the sample reportYou ride a short test on your own roads. You upload the FIT file. Seconds later you get your personal performance profile: every value traces back to a published model, and every recommendation is based on your own data.
Two maximal efforts for the Comprehensive Test, 3' + 12' or 5' + 20', or one short all-out effort for the Quick Test. Ideally on a steady climb, but a flat road works too. Pacing, fueling, and consistency between retests all matter: the full protocol walks you through each option.
Read the full protocol →
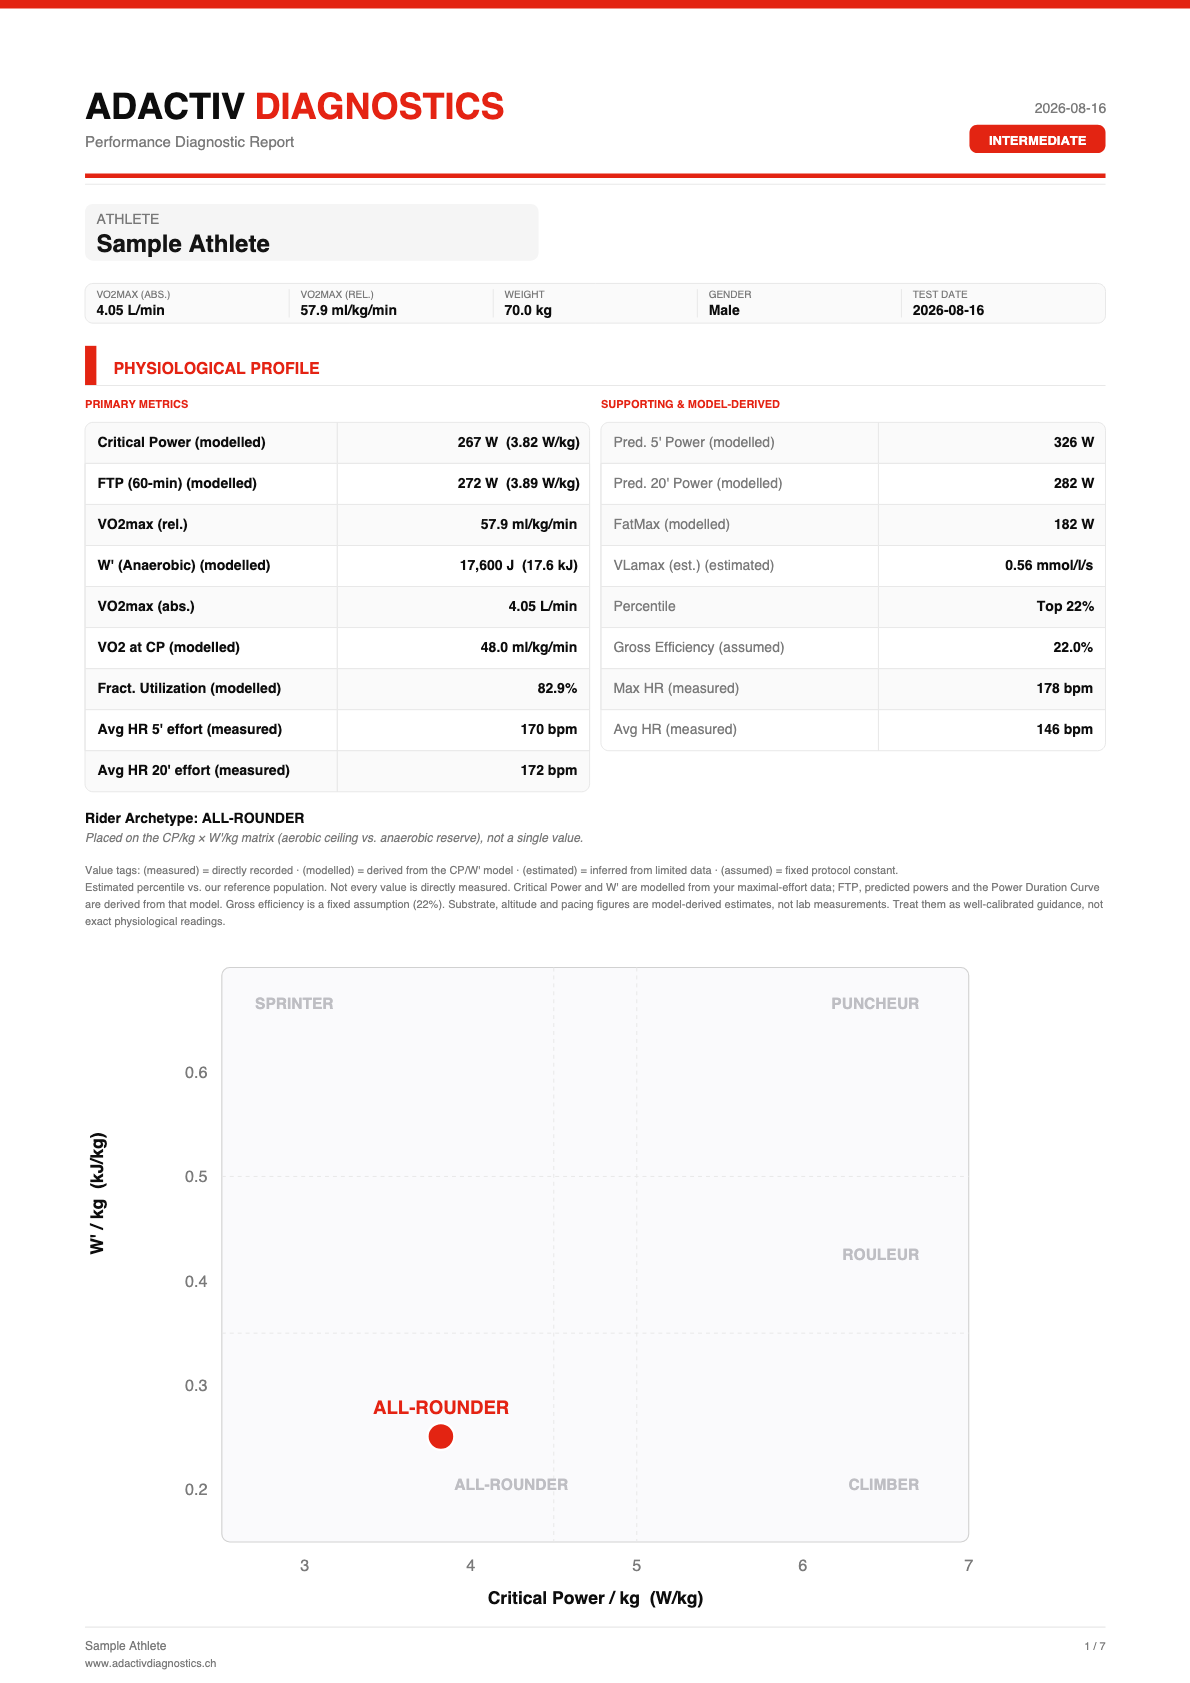
1Report page 1
Unlike FTP, a true physiological threshold: the highest power you can sustain aerobically over the long run. It is the foundation for your training zones and for steering your endurance training.
2Report page 1
The maximum power you can hold for 60 minutes. Classically set at 95% of a 20-minute test ridden after a hard pre-fatiguing effort. In your report it is modelled from CP and W′.
3Report page 1
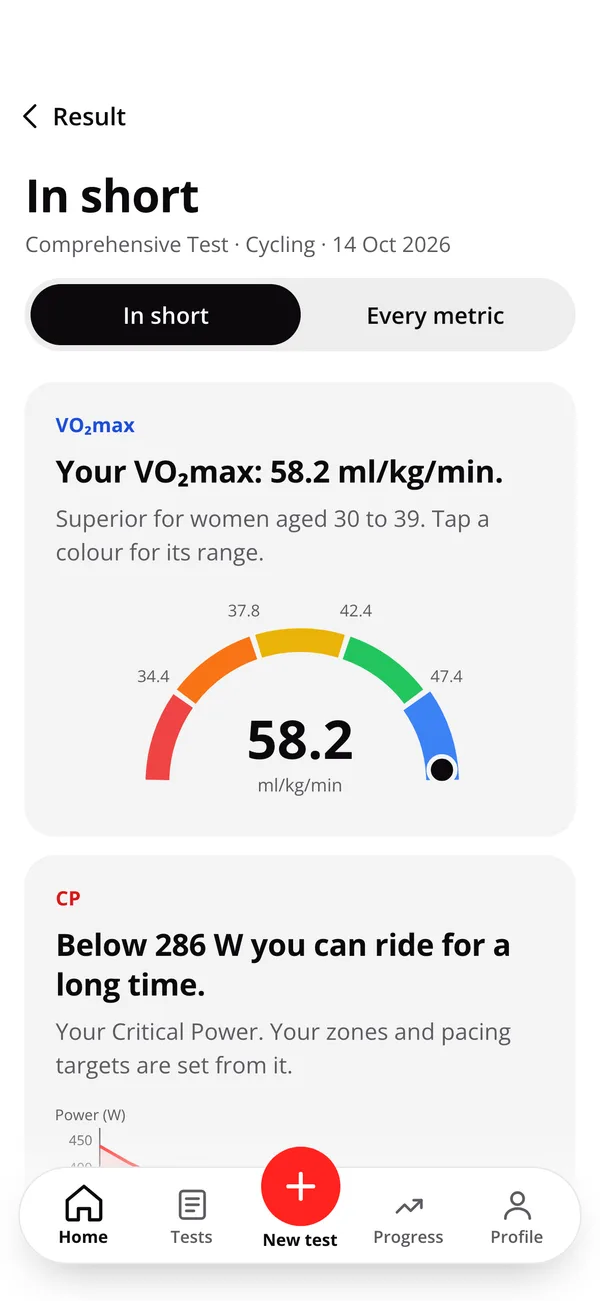
VO₂max is the foundation of your endurance: it shows how much oxygen your body can take up and use per minute at full effort, and so forms the basis of your athletic performance.
4Report page 1
The fixed amount of work you can do above CP before exhaustion, measured in kilojoules. Combined with CP, it determines how long you can hold any suprathreshold power: the basis of the W′ depletion model.
5Report page 2
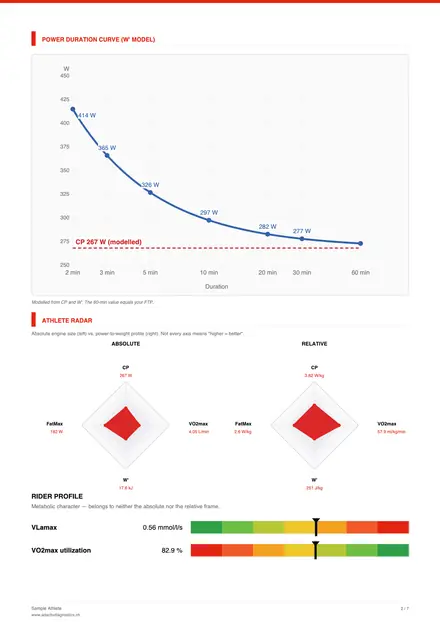
This curve shows your estimated best power for efforts from 2 to 60 minutes. The red dashed line marks your Critical Power. Above it you spend your W′ reserve; below it you can hold the power far longer without fatiguing.
6Report page 2
Your performance in absolute terms, without the influence of body weight, compared against a reference population: CP, VO₂max, W′ and FatMax at a glance. Beside it, the same values per kilogram of body weight.
7Report page 2
Your metabolic signature: what makes you the rider you are. VLamax shows how strong your anaerobic, glycolytic system is; VO₂max utilization shows how much of your VO₂max you already use at CP.
8Report page 3
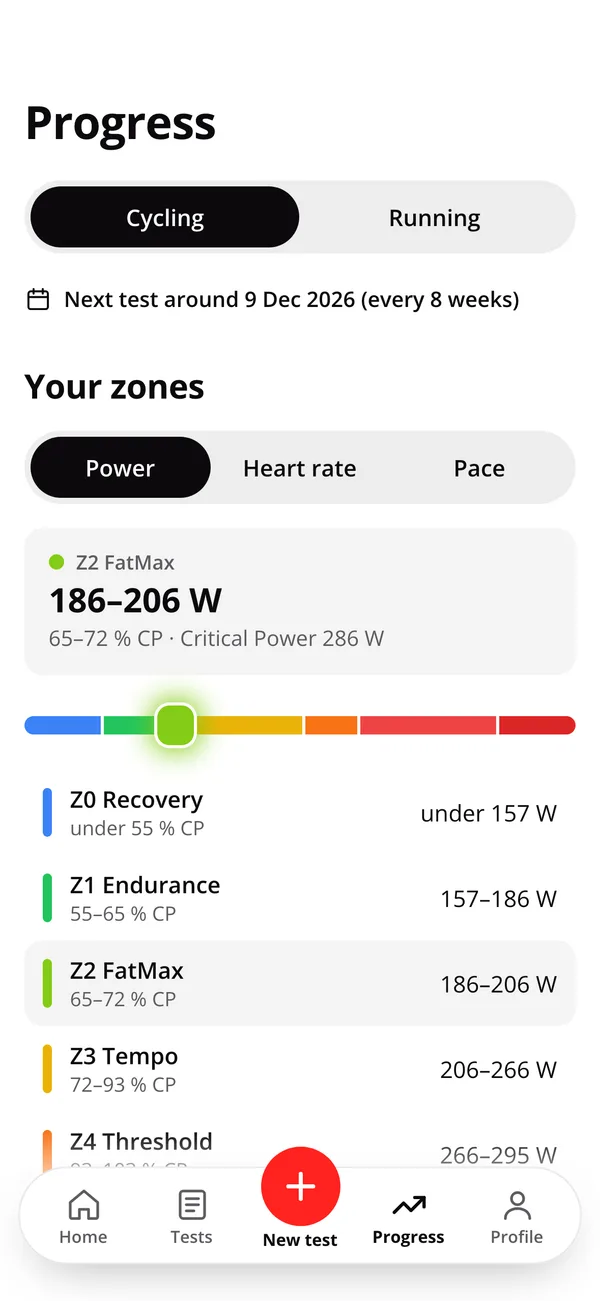
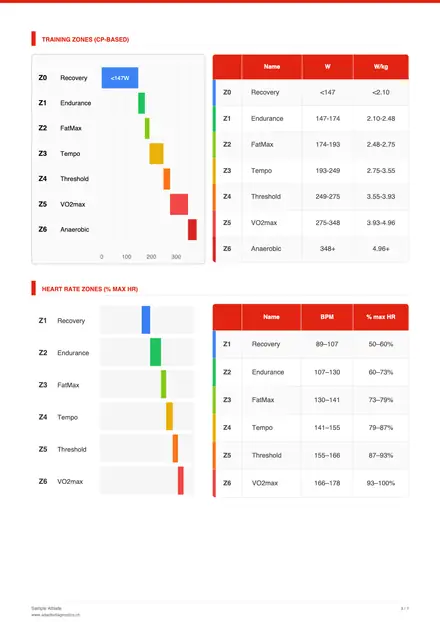
Seven individual training zones help you steer your training with intent. Each zone has a clear goal: from base endurance in Zone 1 to improving your VO₂max in Zone 5.
9Report page 3
Six zones anchored to your maximum heart rate: the highest in your recording, or entered by you. They complement the CP-based power zones: used together, the two zone models are ideal for steering your intensity.
10Report page 4
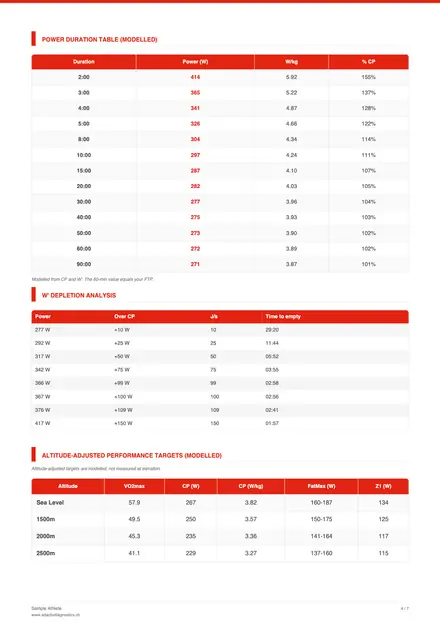
Your predicted best watts at key durations, from 2 to 90 minutes, with W/kg and % of CP. Use this to set interval targets or benchmark rides.
11Report page 4
In essence a pacing table: it tells you how long you can hold a given power above your CP before your W′ runs out. On a climb, for example, you know how hard you can go without blowing up before the top.
12Report page 4
Your power zones for altitude: an overview of how your numbers change at elevation. At an altitude training camp, for example, you can steer your intensities well at any time, with matching VO₂max, CP, FatMax and Z1 values for different altitudes.
13Report page 5
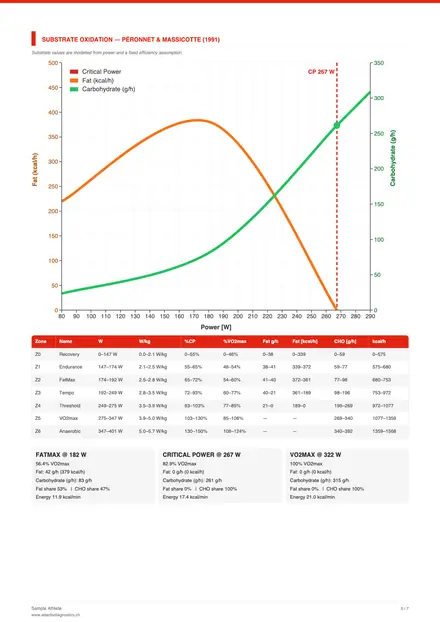
The curve shows how your fat and carbohydrate burn shift as intensity rises. At low intensity your body uses more fat; at high intensity carbohydrate demand climbs sharply. This is how you spot when fueling becomes decisive for holding your performance longer.
14Report page 5
See how much energy you burn in each training zone, and whether your body is drawing mainly on fat or carbohydrate. That lets you plan your fueling deliberately and match it to the effort.
15Report page 6
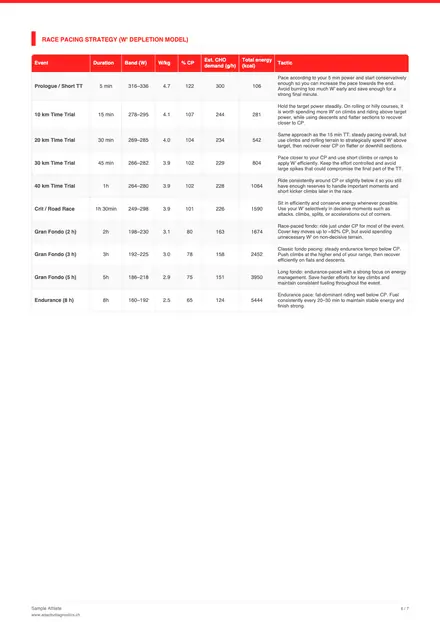
Get clear power and fueling targets for different race distances. That lets you pace your race under control and use your energy better all the way to the finish.
16Report page 7
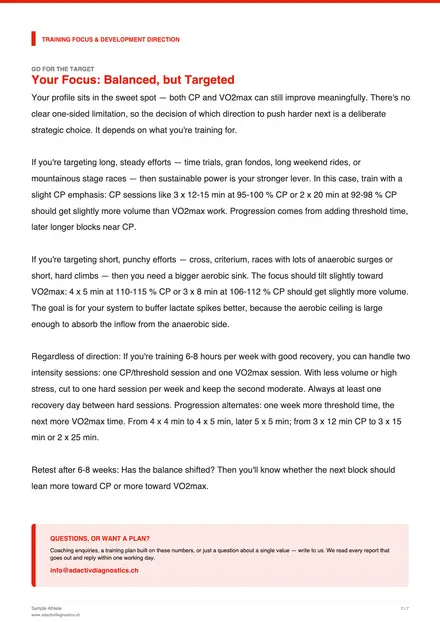
The heart of your analysis. We don’t prescribe fancy training methods, we identify the one physiological weakness that limits your performance, then tell you exactly how to attack it. No ambiguity, no generic advice, just the single focus that makes the difference.
one-time, no subscription
Fr.19
one-time, no subscription
Fr.39
Every test after your first one is 10% cheaper.
Classic lab diagnostic
from Fr. 200.–
 Adactiv Diagnostics
Fr. 19.– / Fr. 39.–
Credits instead of single payments. 1 credit = 1 Comprehensive Test, a Quick Test costs half a credit. Each bundle size is CHF 3 cheaper per test than the one before, and credits never expire.
From 100 credits you can also pay by invoice: info@adactivdiagnostics.ch
Buy credits as a coach
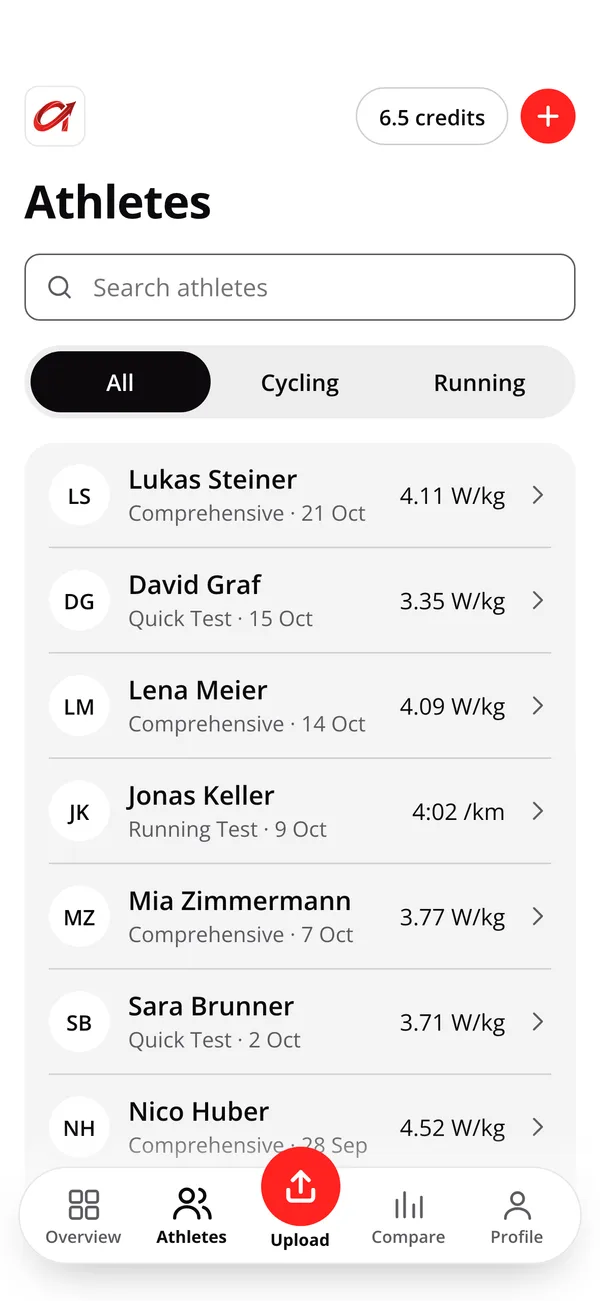
Test your entire team at reduced rates. Sign up as a coach to buy credits and invite your athletes, or just run the tests yourself.
Test your entire team at reduced rates.
Sign Up as CoachYour values, your progress and every report on iPhone and Android. Join the waitlist and we'll write to you once, when it's out.
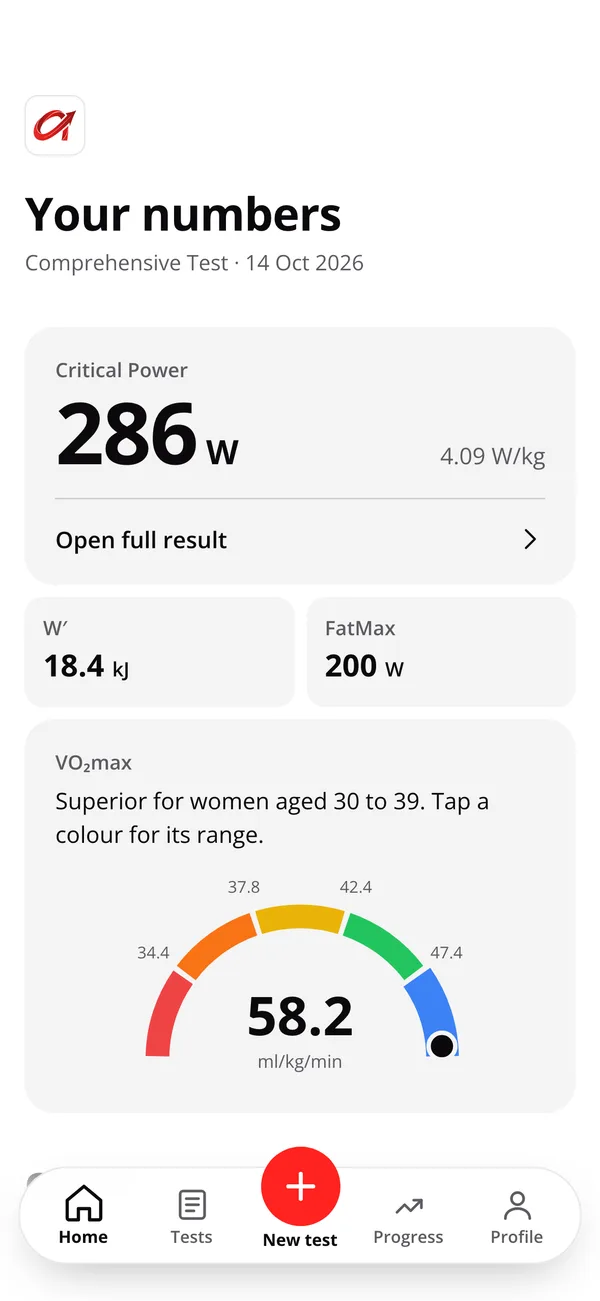
Critical Power, W′, VO₂max and your zones from your latest test.
Still have a question? Email us at info@adactivdiagnostics.ch.
Any cycling computer that exports .FIT files: Garmin, Wahoo, Hammerhead, Bryton, Stages, and more. Your ride just needs to contain power data.
Yes. The analysis uses wattage data to derive your physiological profile. Heart rate alone is not sufficient for this level of accuracy.
Any ride that includes a sustained hard effort. A race, a hard group ride, or a dedicated max-effort test all work.
The formula comes from a lab study of 46 cyclists whose VO₂max was measured by spiroergometry (Sitko et al., 2022). Its input is your 5-minute power per kilogram, which we model from CP and W′. In that study it explained 61–77% of the differences between riders, with a typical error of about ±5 ml/kg/min. Treat the number as a well-founded estimate, not a lab measurement: it means most when you compare your own tests over time.
Your .FIT files are processed in-memory and never stored on disk. Analysis results are encrypted and only accessible via your unique session link.
Absolutely. The diagnostic provides training zones, metabolic breakdown, and a clear training focus & development direction: a solid basis for planning your athletes' training.
Email us anytime at info@adactivdiagnostics.ch: questions, custom team packages, or feedback on your report. We reply within one working day.
Just getting into cycling and want a basic read on your performance? The Quick Test is the right choice: it gives you the key performance metrics quickly and without fuss. Already training regularly and chasing ambitious goals? Then the Comprehensive version is worth it: it offers much more detailed analysis and individual insights to steer your training more precisely and keep raising your level.
Yes. Upload the FIT files of all maximal efforts together: all files in one upload count as one test. With three or more efforts the model also needs a maximal sprint of 30–60 seconds, ridden outside those efforts and reaching at least 1.6 times the CP of the 2-parameter model. If it is missing, the tool automatically uses the proven 2-parameter model and tells you why in the report.
The same one as the first time. Values from 3′ + 12′ and 5′ + 20′ are comparable, but not identical: switching protocols looks in the data like a change in performance that is not one. Choose one protocol, keep the conditions the same, repeat every 6 to 10 weeks.